About Taktile
Taktile is a Cambridge-based startup that uses retrofit sensors to help labor-intensive manufacturers measure and manage their productivity.
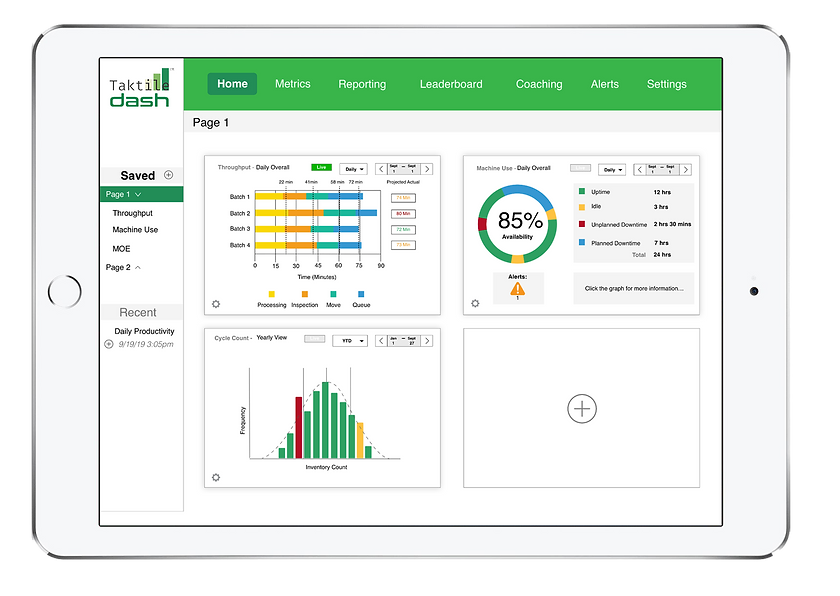
They are developing software to clearly display data in a dashboard format with additional analysis and management capabilities to help clients quickly make proactive management decisions.
What is the problem?
Taktile needs a software solution to communicate key metrics to manufacturing clientele so that they can quickly identify the current status of their operations and address issues on the factory floor.
Sales Deck
CLIENT
Taktile Mfg.
MY ROLE
User Researcher
Interviewer
Prototyping
UI Design
TIMELINE
3 week sprint
TOOLS
Adobe Creative Suite
Sketch
InVision
Solution
By designing an intuitive and powerful dashboard, we can provide Taktile’s clients with the key data they need to make informed decisions about their operations.
We will know this to be true when clients report that their desired data is easy to access, factory operations have improved based on better informed data, and/or issues in manufacturing processes are being identified more quickly.
Project Goals

Approach
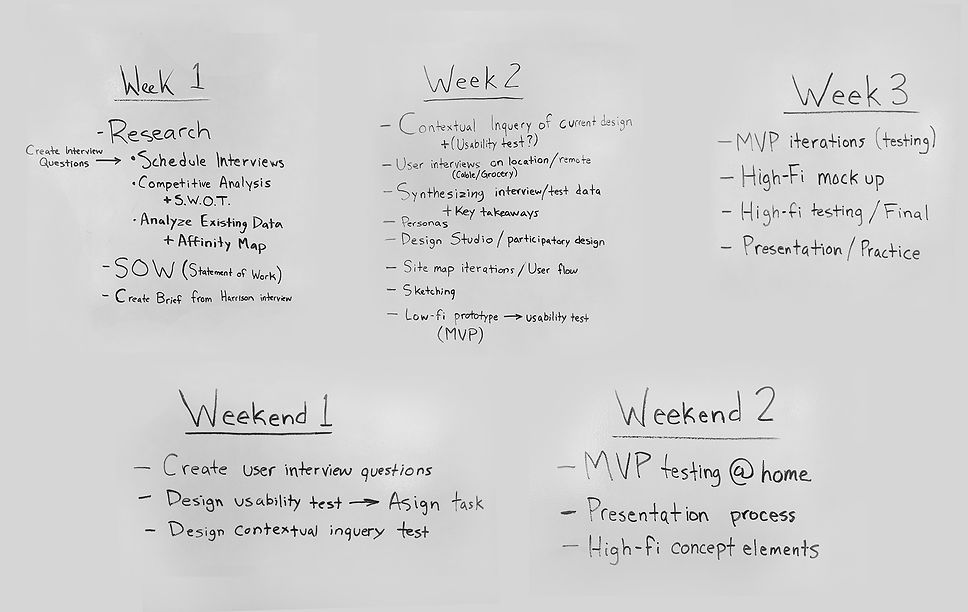
We began our approach by creating a project plan outlining the timeline and schedule, setting goals and objectives every day. Each member of the team had specific daily tasks to achieve and would report their progress to the group at the end of the day. Since there was no project manager we all held each other accountable and worked collaboratively.

Project Plan
The project plan was devised in 5 phases. 3 sets of week long goals and 2 detail
oriented weekend goals. The task was to stay on schedule through all aspects of the
project since our team would realistically lose a handful of days organizing
conference calls and in-person team meetings.
Initial Research and Synthesis
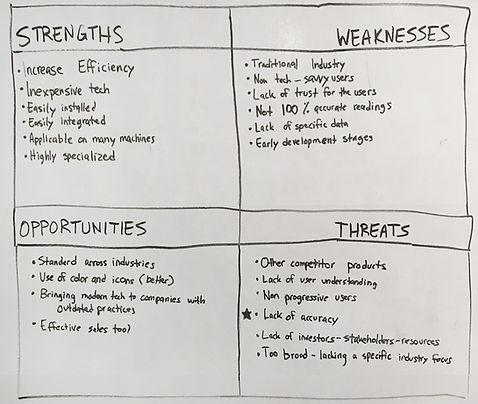
Our first step was to developed a
SWOT chart displaying the Strengths, Weaknesses, Opportunities and Threats that currently exist with within the market.
After populating the chart with content it was obvious that there was a need for the product and it would be viable to develop.
An issue we faced early in the process was our team had limited knowledge about the manufacturing industry.
This made every step of our research
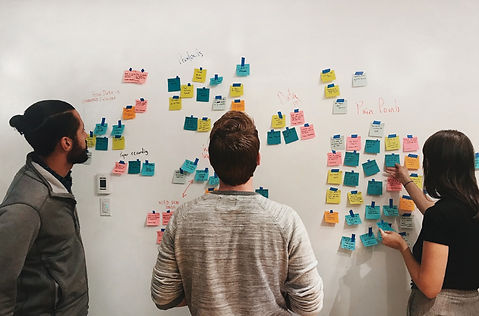
process essential. Thankfully our client provided a substantial amount of research about his users. Each team member split up the interview notes, synthesized the findings, and congregated together to
build an interview affinity map.
We quickly discovered from those initial interviews that these users had similar pain points, wants and needs regardless of what manufacturing company they worked for. We conducted an additional 6 phone interviews and visited 2 factories to see their process.

Key Interview takeaways
"I'm noticing a lot of inefficiencies
in our current processes"
"I need my data to be meaningful"
"I don't trust the data"
"I need specific metrics"
"I need a way to access data
more efficiently"
"I need a place for all the data"
"I need a way to give and get data"
"I need to convert to digital"
On-site Visits
It was important to broaden our understanding by visiting some factories Taktile is working with. We interviewed users on site then conducted a usability test on employees with our low-fi prototype. Because of our limited knowledge of the manufacturing process these site visits helped us get a better understanding of our users daily
tasks, pain points, and needs.
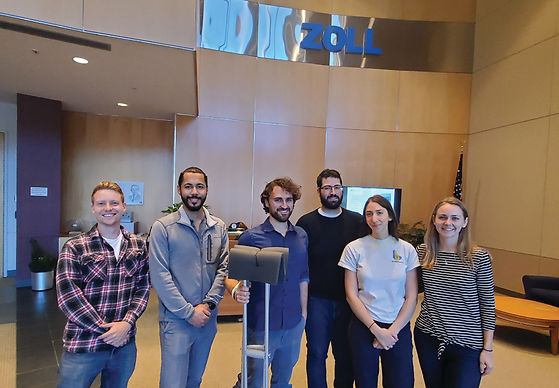
ZOLL Medical Corporation, Chelmsford Ma
What did we learn?
Most manufacturing companies had outdated software systems that were struggling to scale with the company and difficult to integrate
Managers felt that there were a number of metrics that they would want to reference at a glance
Managers also wanted detailed data analysis to be quick
and easy to access
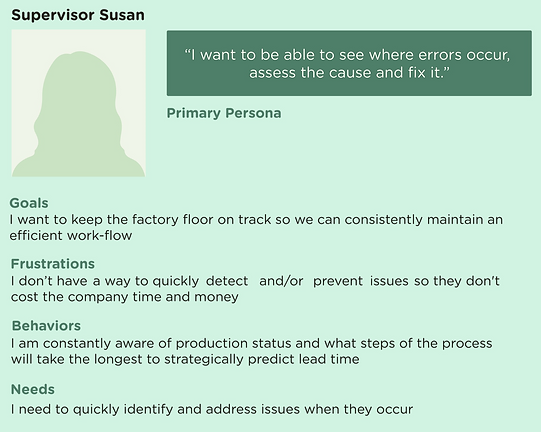
Primary Persona
Through our clients extensive research notes and the numerous interviews conducted by our team, we were able to identify our personas. The main user groups consisted of three users for this application: “Supervisors”, “Managers”,
and “Operators.” We chose to focus on the Supervisors since
all three groups had very
similar goals and needs.
Competitive Analysis
Our team took a look at the software of various competitors to evaluate which features appeared to best fit the needs of our users. We attempted to utilize
the best aspects of each competitor's interface and interaction designs to come up with the most user-focused product for Taktile.
Layout
Interactions
Chart Types
Graphics
Alerts
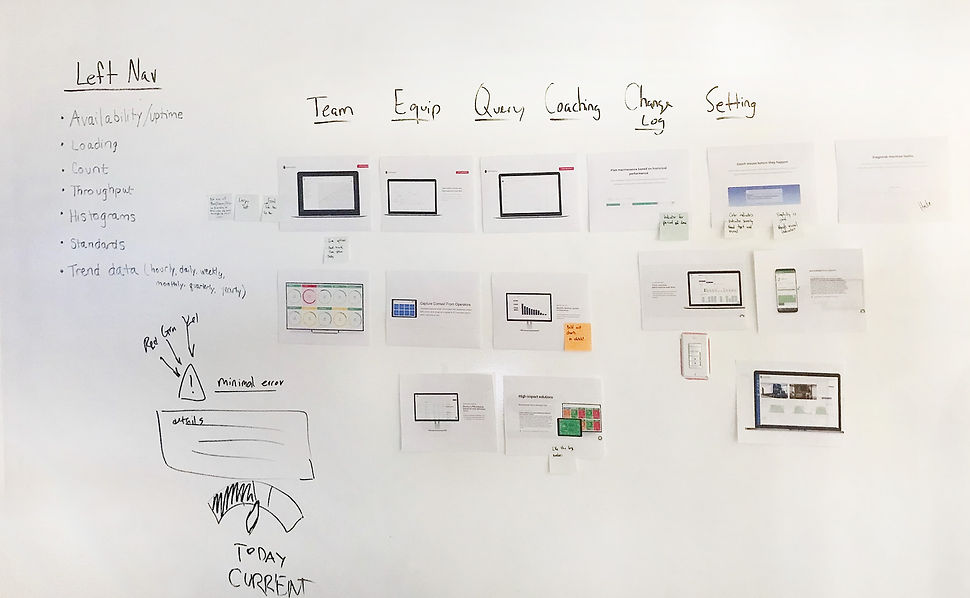
Design Studio
Once we identified the features we thought worked best for our competitors, we participated in a design studio to compile
those ideas into a single cohesive design. Our team printed out relevant interface elements from competitors current software solutions.
As a group we analyzed and discussed what worked best and which elements and features we thought our product could improve upon.
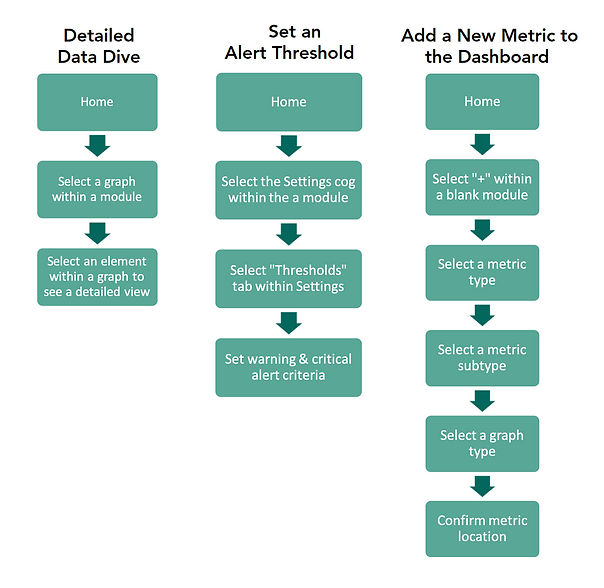
User Flows
The user flows below displays some of the key functionality we
wanted to illustrate within the dashboard. These actions represent tasks we felt
(based on our research) were realistic tasks a user would complete on a daily use.
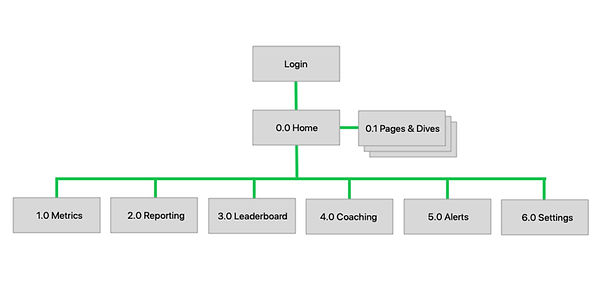
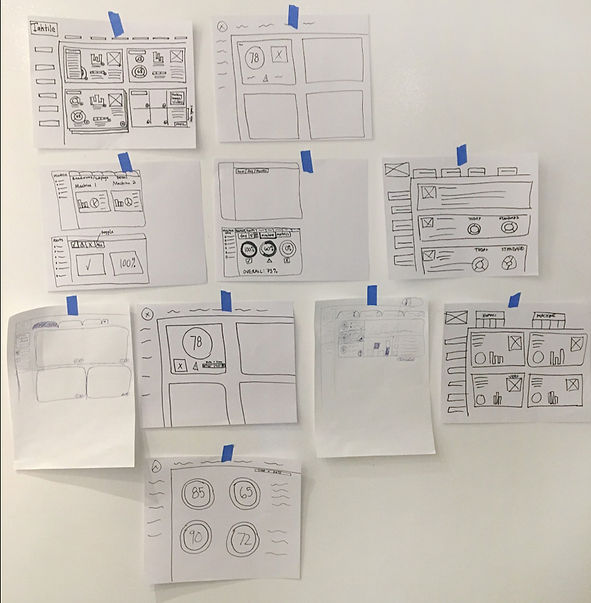
Site Map
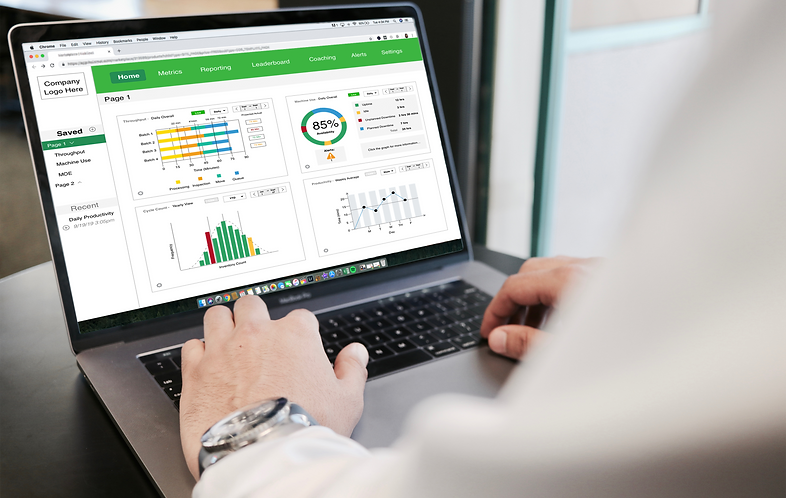
Building the Dash
Based on the features we selected to showcase, we
were able to build out a
basic sitemap designed to
fit our users' needs in a way that was simple to navigate.
Testing our Iterations
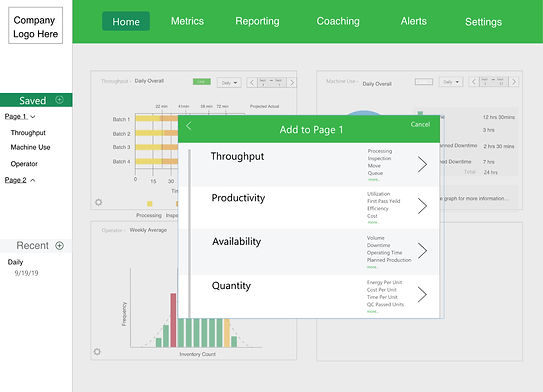
Two rounds of usability tests were conducted with four users. We learned that preferences varied from manager to manager, so we focused on making sure that our designs were fully customizable and easy to edit.
Besides creating a catalog of metrics, we added options for users to select the graph type that best allowed them to visualize the data they needed.
Improvements within the hierarchy of the sub navigation panel were made to indicate the ability to save and refer back to recently viewed metrics so the user would never lose the data they had just collected.
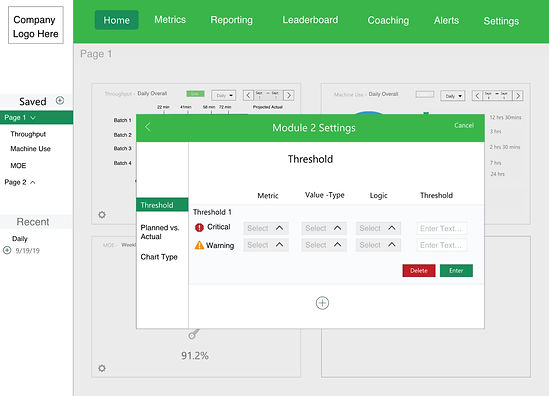
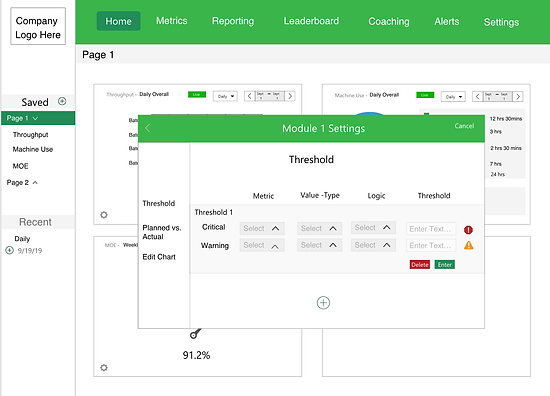
During testing we noticed users struggling to select "Delete" & "Enter"
so the decision was made to increase the button sizes.
Warning and Critical icons were also added to better assimilate the visual nature of this software.

Continual Iterations
Through our series of usability testing we learned that users wanted to see the sub categories within each category. We made sure to include this minor detail since our users stressed its importance.
Minor adjustments were continually made when we drew closer to completion. Visual effects were added once we had established a strong functional product. These effects included raised models and drop shadows to provide tactile depth for the users
Next Steps
Taktile's dashboard interface proved to be a very complex system. Because the product had to be viable for many different manufacturing vendors and processes, it became very complex to make sure that all of the users needs were met. Our team put so much effort into this product and we were pleased to learn our client was ecstatic with the design. Next steps would include building out the other pages in the main navigation. We wanted to expand upon certain features like adding a user toggle capability between supervisor, manager, or operator.
We also wanted to make a dark mode option for low light settings but chose to focus on more predominate features. Conducting more in depth usability testing would absolutely be done with added time as well. Overall our team was pleased
with the results.